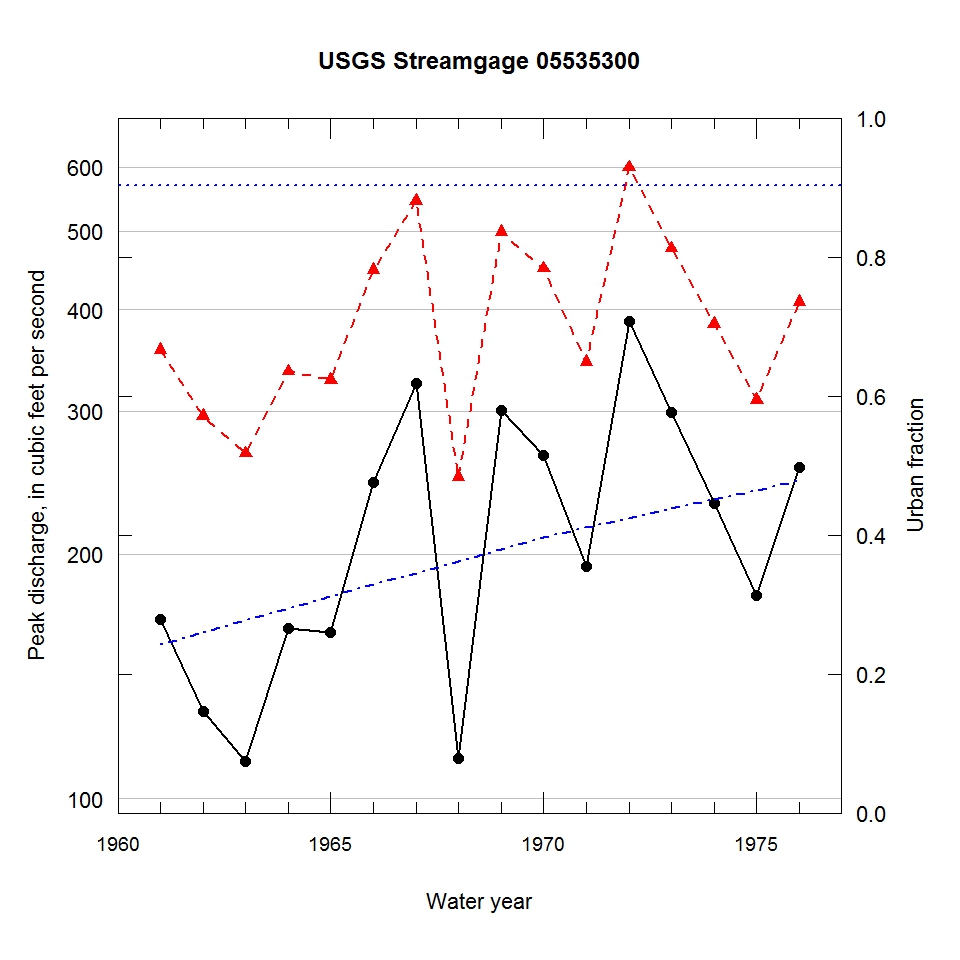
Observed and urbanization-adjusted annual maximum peak discharge and associated urban fraction and precipitation values at USGS streamgage:
05535300 WF OF NB CHICAGO RIVER AT BANNOCKBURN, IL


| Water year | Segment | Discharge code | Cumulative reservoir storage (acre-feet) | Urban fraction | Precipitation (inches) | Observed peak discharge (ft3/s) | Adjusted peak discharge (ft3/s) | Exceedance probability |
| 1961 | 1 | -- | 0 | 0.242 | 1.383 | 166 | 357 | 0.593 |
| 1962 | 1 | -- | 0 | 0.260 | 0.249 | 128 | 296 | 0.760 |
| 1963 | 1 | -- | 0 | 0.277 | 1.130 | 111 | 266 | 0.829 |
| 1964 | 1 | -- | 0 | 0.294 | 1.779 | 162 | 336 | 0.649 |
| 1965 | 1 | -- | 0 | 0.311 | 0.504 | 160 | 328 | 0.670 |
| 1966 | 1 | -- | 0 | 0.328 | 0.417 | 245 | 448 | 0.364 |
| 1967 | 1 | -- | 0 | 0.345 | 1.470 | 325 | 545 | 0.188 |
| 1968 | 1 | -- | 0 | 0.363 | 1.146 | 112 | 249 | 0.870 |
| 1969 | 1 | -- | 0 | 0.380 | 1.287 | 301 | 499 | 0.251 |
| 1970 | 1 | -- | 0 | 0.397 | 1.335 | 265 | 450 | 0.359 |
| 1971 | 1 | -- | 0 | 0.411 | 0.386 | 193 | 345 | 0.624 |
| 1972 | 1 | -- | 0 | 0.424 | 0.693 | 387 | 599 | 0.144 |
| 1973 | 1 | -- | 0 | 0.438 | 1.386 | 299 | 476 | 0.296 |
| 1974 | 1 | -- | 0 | 0.451 | 0.524 | 231 | 384 | 0.519 |
| 1975 | 1 | -- | 0 | 0.465 | 0.953 | 178 | 310 | 0.724 |
| 1976 | 1 | -- | 0 | 0.478 | 0.976 | 256 | 409 | 0.459 |

